Visual Analytics Platform
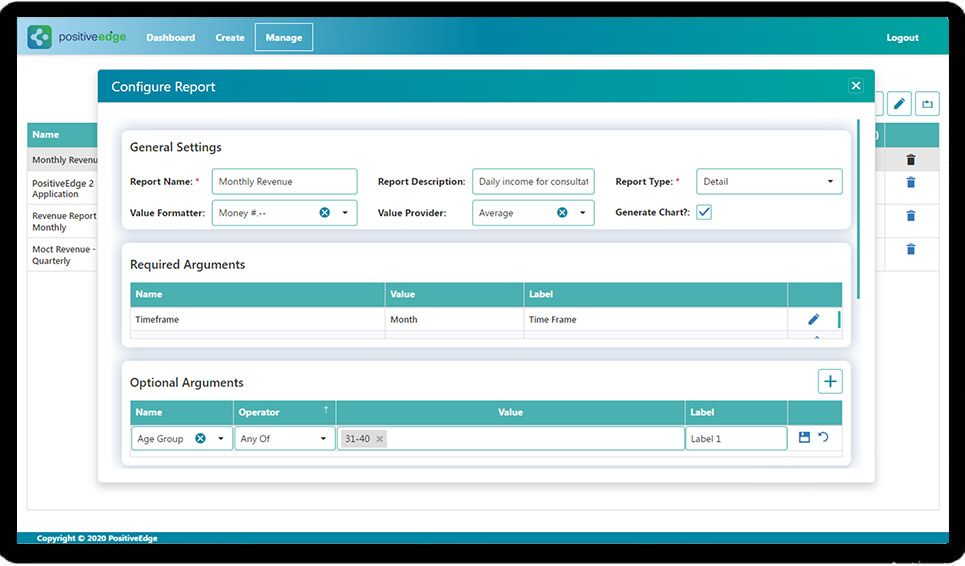
Easily create, configure and visualize reports and dashboards in the form of tables, pivot tables, line charts,
bar charts and gauges from various data sources.

An intuitive and powerful Reporting and Analytics application that can connect to data warehouses, relational databases, flat files, web services and a host of other types of sources to fetch data for analytics.
Easily create, configure and visualize reports and dashboards in the form of tables, pivot tables, line charts,
bar charts and gauges from various data sources.

All reports are exportable for off-line analysis or use in presentations. Reports may be scheduled to run at specific times at specific frequencies. Custom presentation of these reports may be defined and distributed to designated users.
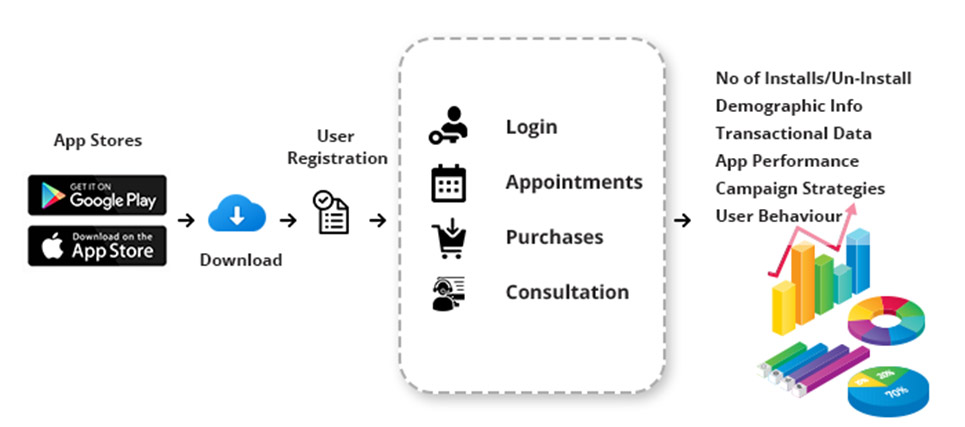
Event Recorder helps track all important activities like Installs, Registration, Logins, Transaction types, Logouts and Uninstalls, and provides valuable insights based on demographics.


We use cookies and other tracking technologies to improve your browsing experience on our website, to show you personalized content and targeted ads, to analyze our website traffic, and to understand where our visitors are coming from. While using our website, we may ask you to provide us with certain personally identifiable information, that can be used to contact you about our service offerings. By browsing our website, you consent to our privacy and cookies policy.